
2026 shaped up as a pivotal year for Solana, with whale activity and institutional flows shaping price direction. On-chain data also showed Solana processing eight times more Daily Transactions than rival networks. That backdrop raised a key question: Did Solana maintain momentum, or did cracks begin to form?
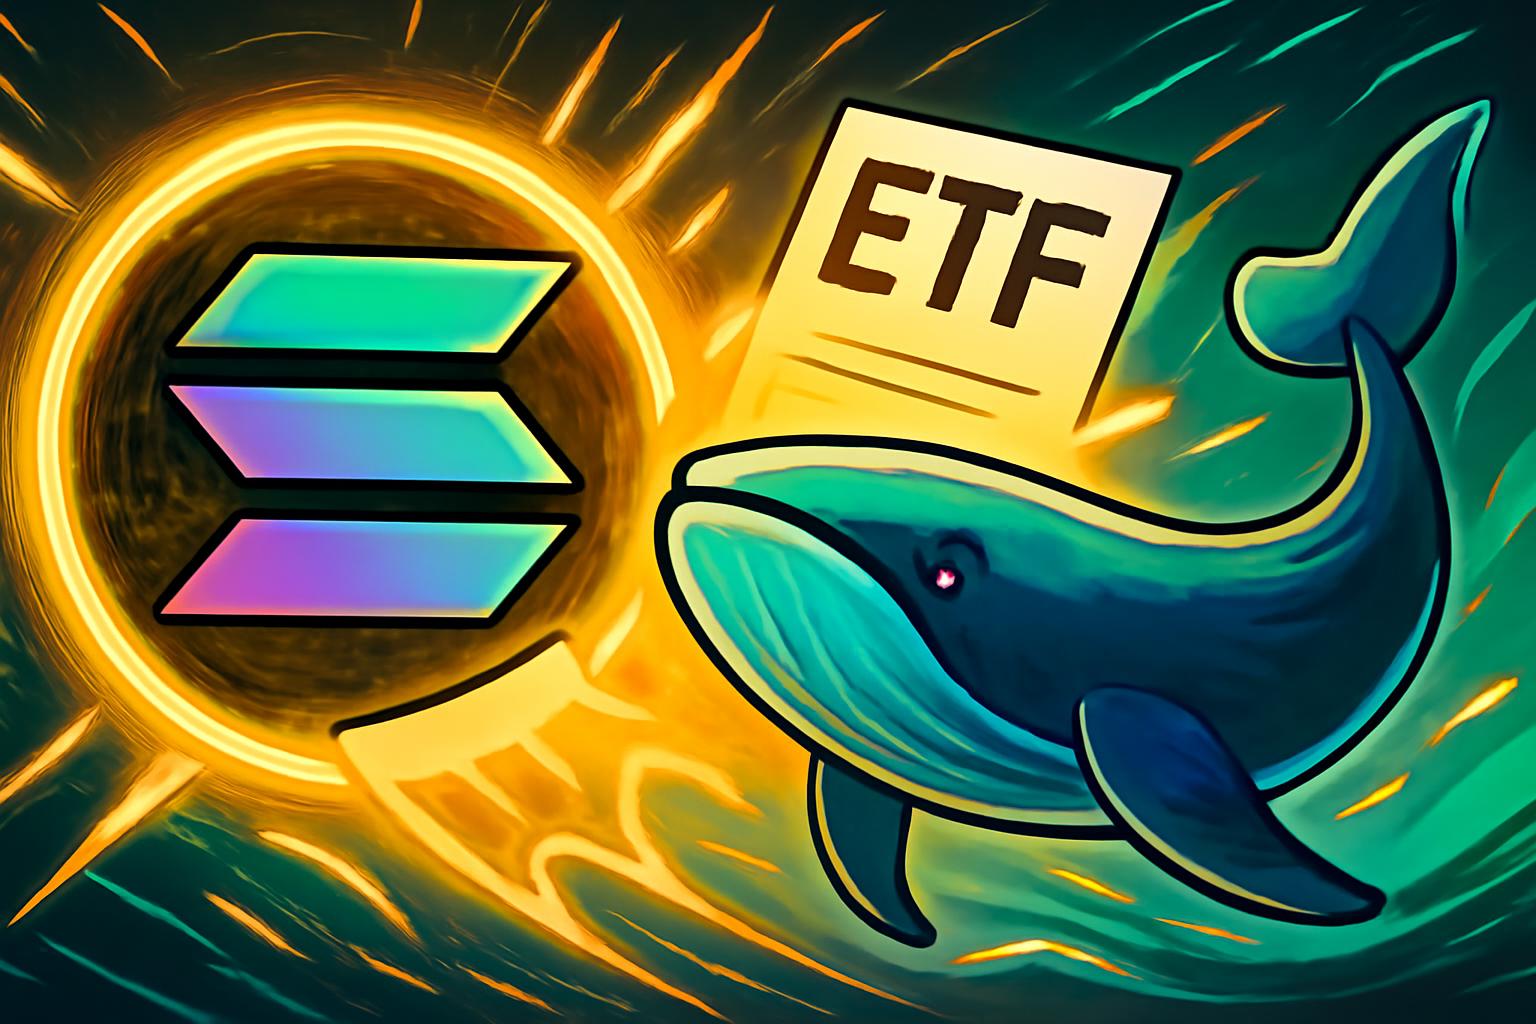
Solana’s new whales, represented by ETFs, continued to pour bullish capital into the ecosystem since the 4th of December, fueling price growth. The combination of ETF inflows and whale activity suggested a strong position, though Solana needed to navigate key support levels for sustained growth. On top of that, a dormant whale reactivated with an 80K SOL buy worth $10.87 million from Binance, signaling strong market conviction.
Looking at the daily chart, Solana traded at $136 on the 10th of January, but faced downside risks if it completed equal lows around $102 in a bearish market. On the weekly timeframe, Solana faced pressure if it failed to hold the $122-$145 range on lower timeframes. Losing $122 support could lead to a drop to $102, marked by equal highs and a loss of ascending support, pointing to the 61% Fibonacci retracement at $102.
If Solana lost this zone, it could drop further into the $50s. Weakness in RSI and MACD indicated bottoming and increased downside risks if these levels failed. Solana’s 2-week Liquidity Heatmap showed concentrated positions below $120, which could act as a magnet for downside pressure if bearish sentiment intensified.
A sharp move into that zone risked accelerating liquidations, especially during broader market weakness. Solana’s market structure remained supported by ETF demand and whale accumulation, even as technical signals weakened. Price action around the $117–$120 zone may shape near-term sentiment, especially if broader conditions soften.


Leave a Reply